Santa Clara County (SCC): Home Prices Up, Sales Down in June
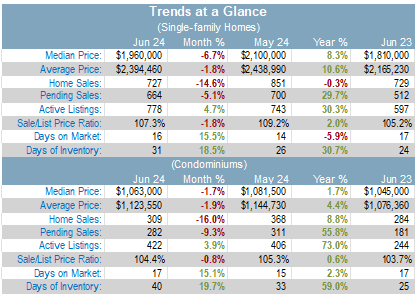
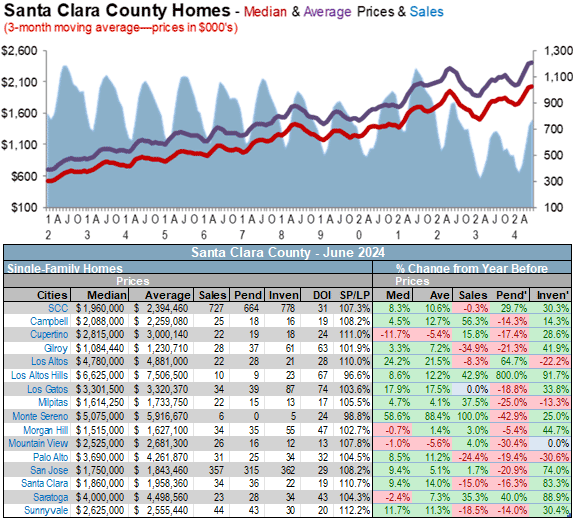
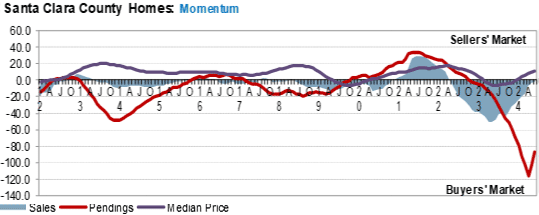
The median sales price for single-family, re-sale homes was up 8.3% compared to last year. The median sales price was $1,960,000.
The average sales price for single-family, re-sale homes was up 10.6% year-over-year. The average sales price was $2,394,460.
Sales of single-family, re-sale homes were down 0.3%, year-over-year, in June. There were 727 homes sold in Santa Clara County last month. The monthly average since 2000 is 987.
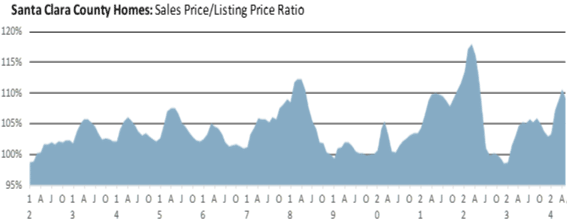
The sales price to list price ratio fell from 109.2% to 107.3%.
Pending sales were up 29.7% year-over-year. There are 664 homes in escrow.
Inventory of single-family, re-sale homes was up 30.3% compared to last year. As of July 5th, there were 778 homes for sale in Santa Clara County. The average since January 2000 is 2,703.
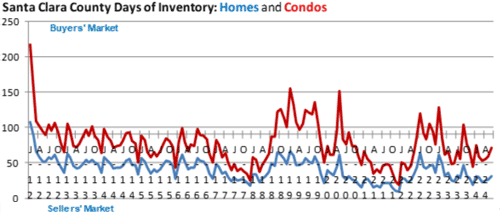
Days of Inventory, or how long it would take to sell all homes listed for sale at the current rate of sales, rose from 26 days to 31 days. The average since 2003 is 89.
It took sixteen days to sell a home last month. That is the time from when a home is listed for sale to when it goes into contract.
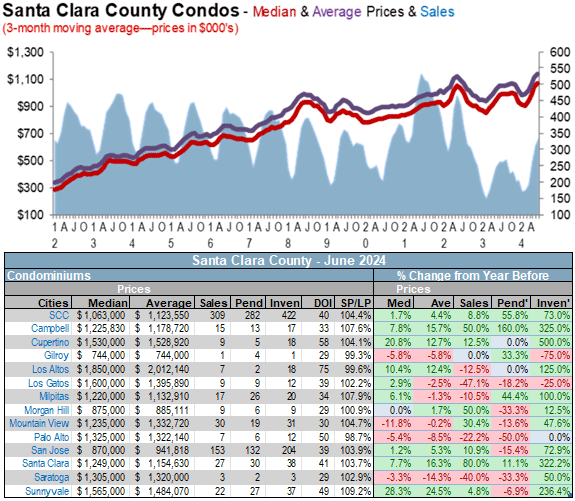
Condo prices were also up last month. The median sales price for condos was up 1.7% compared to last June. The median sales price was $1,063,000. The average sales price gained 4.4% year-over-year. The average sales price was $1,123,550.
Condo sales were up 8.8%. There were 309 condos sold in June.
The sales price to list price ratio fell from 105.3% to 104.4%.
Pending sales were up 55.8% year-over-year. There are 282 condos in escrow.
Condo inventory was up 73% compared to last June.
As of July 5th, there were 422 condos for sale in Santa Clara County. The average since January 2000 is 757.
Days of inventory rose from thirty-three to forty.
It took an average of seventeen days to sell a condo last month.
If you are planning on selling your property, call me for a free comparative market analysis.
June 2024 Sales Statistics (SCC)
* Total inventory is active listings plus pending listings. Active listings do not include 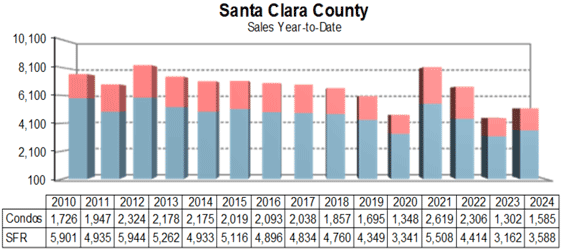 pending.
More information is available in our on-line report at http://avi.rereport.com/market_reports
A Matter Of Debate (SCC & SMC)
June 28, 2024 — Will it be one move by the Fed this year to lower rates, or two? This has more or less been the topic of debate among investors over the last few weeks. Based upon Fed members’ collective outlooks, the inference derived from those forecasts is that one cut is a virtual guarantee, with a second one a possibility. What will solidify the prospect for a second cut will be continued or even new steps in the right direction for inflation, economic growth and labor market conditions.
In last week’s MarketTrends, we discussed how the housing market is stumbling into the summer. Two more reports out this week reinforced this outlook, reflecting both tepid present and future demand. The first report noted that sales of newly-constructed homes slumped in May, falling by 11.3% to a 619,000 annual pace from an upwardly-revised 698,000 rate in April (originally reported as 634K). The drop off in sales helped balloon supplies of new homes to 9.3 months at the present rate of sale, with the 484,000 (annualized) houses available for purchase the highest in more than 16 years. With sluggish demand and greater supply, the price of new homes has been relatively flat and soft; the $417,400 median cost of a new home in May was down about 1% from year ago levels. It is interesting to see that, at least in May, the current cost of a new home is actually lower than the median selling price of an existing home sold last month.
Looking forward, sales in the existing home market may come to a quick and quiet end to the already-muted spring homebuying season. The Pending Home Sales Index from the National Association of Realtors declined for a second consecutive month, falling in May by 2.1% and landing at a record low value in a series that runs more than 20 years. This measure of signed home purchase contracts informs sales figures a month or two into the future, suggesting a continued slowing for existing home sales in June and July. Projecting off of the 4.11 million annual rate of sales for May, this could put June or July sales at a 4.02 million pace or thereabouts.
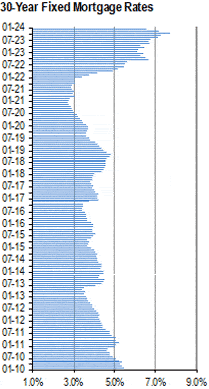
Applications for mortgage credit managed a 0.8% increase in the week ending June 21. The Mortgage Bankers Association reported that requests for funds to purchase homes firmed up by 1.2%, making it a rare three-week string of increases, while those for loans to refinance existing mortgages settled back by 0.1%, a second straight decline. Mortgage rates have slipped below the 7% mark on average over the last few weeks, enticing at least a few more home buyers to try to grab the best rate they possibly can, even if it still a fairly high one.
Even as there has been more favorable data recently, mortgage rates could manage only the barest of declines this week. Even the improved PCE inflation report for May failed to shift rates lower, and in fact, the influential yields that underlie long-term fixed-rate mortgages actually firmed up somewhat on Friday. While this is a bit at odds with the usual market response to softer growth and easing price pressures, it’s also true that the end of quarters can introduce some temporary distortions in otherwise larger trends.
That said, mortgage rates do appear to be headed slightly higher over the next week, but any increase should be mild and only retrace some of the downward steps taken over the last month. Based upon that, we’d reckon there will be a slight increase of perhaps four basis points or so in the average offered rate for a conforming 30-year FRM as reported by Freddie Mac next week. Due to the Thursday market holiday, that report comes Wednesday at noon.
Call or email me if you have any questions.
For further details and a city-by-city breakdown statistics, go to http://avi.rereport.com/market_reports.
Real estate related Articles
| SJM 08-05-2024 | How will new real estate rules work? Your questions answered |
| Yahoo/finance 05-28-2024 | Silicon Valley luxury home market heats up amid AI boom |
| NAR 05-30-2024 | A Big Mistake Home Buyers Are Making With Their Mortgages |
| NAR 05-03-2024 | What Will the Future Bring? |
California homeowners interested in building accessory dwelling units on their property just caught a break, potentially shaving off thousands of dollars in fees and permits.
In a move proponents say will help ease the Bay Area’s housing crisis, Gov. Jerry Brown on Tuesday signed Senate Bill 1069, making the so-called “granny units” easier and less expensive to build throughout the state.
For more read California eases restrictions on ‘granny units’ and http://www.hcd.ca.gov/policy-research/AccessoryDwellingUnits.shtml
Helpful resource for home owners
Many new home owners or owners who consider remodeling or rebuilding their homes should take advantage of their county Tax Assessor web site. These web site and their respective city building departments web site typically have vest information regarding the process for applying for permits, the impact on their taxes and many other resources that home owners should be aware are available for them.
For the San Mateo County Tax Assessor office visit http://www.smcare.org/default.asp
For Santa Clara County Tax Assessor visit https://www.sccassessor.org/index.php
The Silicon Valley 150 Index Corner
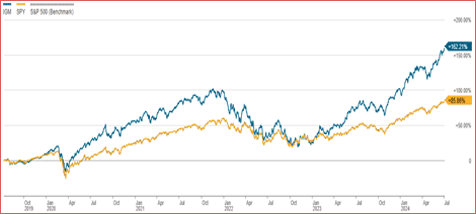
The Silicon Valley’s Real estate market is a derivative of the local economy–it prospers and withers depending on how well the local innovation-based sector performs. The San Jose Mercury News tracks the performances of the largest 150 publicly traded companies headquartered in Silicon Valley through an index called the SV150, which may be found at www.mercurynews.com. Stocks are valued based on several criteria, but one of the more important criteria is a company’s future earnings. Therefore, I see the SV150 as a leading indicator for Silicon Valley’s real estate market.
Investors Corner
S&P CoreLogic Case-Shiller Index Breaks Previous Month’s ALL-TIME HIGH In April 2024
NEW YORK, JUNE 25, 2024: S&P Dow Jones Indices (S&P DJI) today released the April 2024 results
for the S&P CoreLogic Case-Shiller Indices. The leading measure of U.S. home prices shows that the upward trend decelerated in April 2024. More than 27 years of history are available for the data series and can be accessed in full by going to CLICK HERE
U.S. Housing Markets Moving Into Rent Territory for First Time in Over 8 Years: Report
Is it time to seriously consider investing in real estate?
Signup for my Real Estate Investment Alerts and you’ll receive my real estate investment opportunities.
San Mateo County (SMC): Prices Up, Sales Down in June
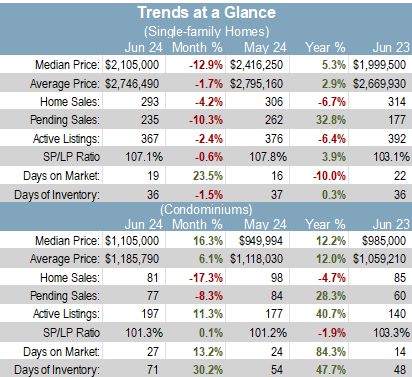
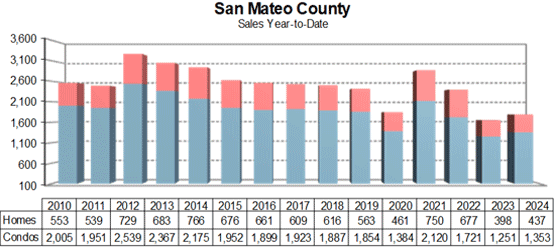
Sales of single-family, re-sale homes in San Mateo County fell 6.7% in June, year-over-year. There were 293 homes sold in San Mateo County last month. The average since 2000 is 398.
The median sales price for single-family, re-sale homes was $2,105,000. It was up 5.3% compared to last year.
The average sales price rose 2.9% year-over-year.
The sales price to list price ratio fell from 107.8% to 107.1%.
Inventory of single-family, re-sale homes was down 6.4% compared to last year. As of July 5th, there were 367 homes for sale in San Mateo County. The average since January 2000 is 1,287.
Days of Inventory, or the amount of time it would take to sell all homes for sale divided by how many homes have sold, fell from thirty-seven days to thirty-six days.
It took nineteen days, on average, to sell a home last month. That is the time from when a home is listed to when it goes into contract.
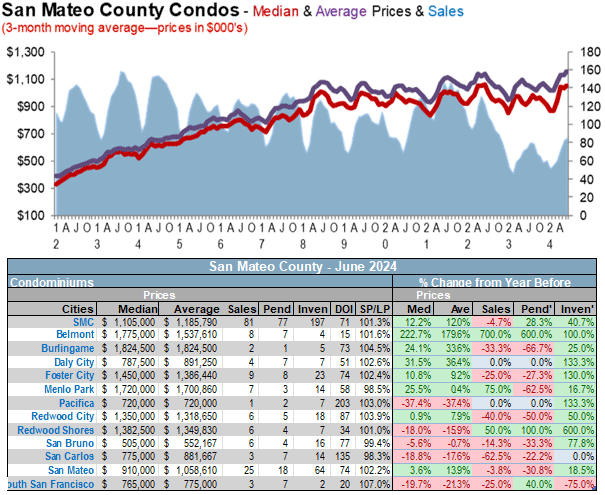
The median sales price for re-sale condos rose 12.2% year-over-year.
Year-over-year, the average sales price gained 12%. It set a new record high at $1,185,790
Condo sales were down 4.7% year-over-year. There were 81 condos sold last month. The average since January 2003 is 122.
Inventory was up 40.7% year-over-year.
As of July 5th, there were 197 condos for sale in San Mateo County. The average since January 2003 is 350.
Days of inventory rose from fifty-four to seventy-one.
It took an average of twenty-seven days to sell a condo last month.
If you are planning on selling your property, call me for a free comparative market analysis.
June 2024 Sales Statistics (SMC)
* Total inventory is active listings plus pending listings. Active listings do not include pending.
You can get more information at: http://avi.rereport.com/market_reports
Call or email me if you have any questions.
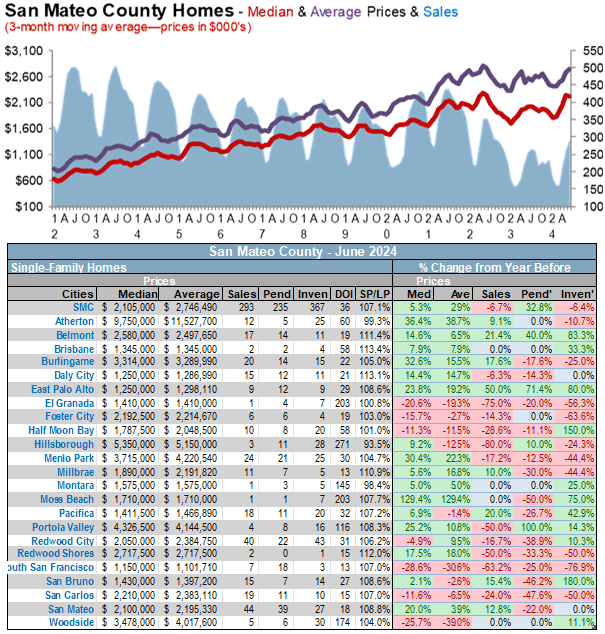
For further details and a city-by-city breakdown statistics, go to http://avi.rereport.com/market_reports.