Santa Clara County (SCC): Prices & Sales Continued Rising in December
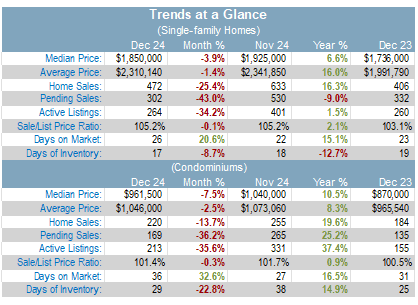
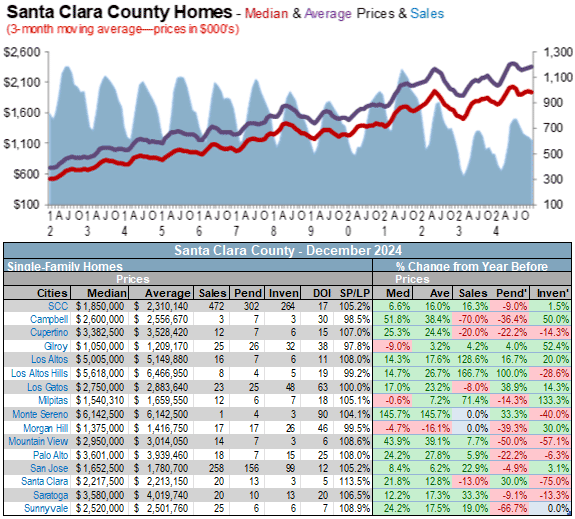
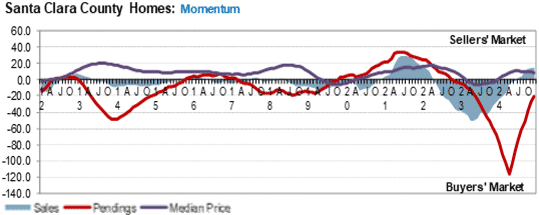
The median sales price for single-family, re-sale homes was up 6.6% compared to last year. The median sales price was $1,850,000.
The average sales price for single-family, re-sale homes was up 16% year-over-year. The average sales price was $2,310,140.
Sales of single-family, re-sale homes were up 16.3%, year-over-year. There were 472 homes sold in Santa Clara County last month. The monthly average since 2000 is 987.
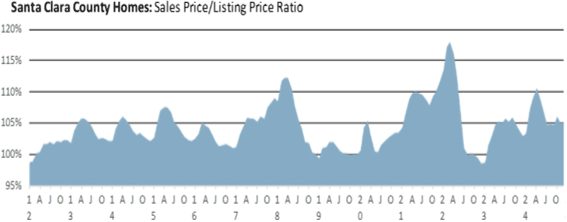
The sales price to list price ratio stayed at 105.2%.
Pending sales were down 9% year-over-year. There are 302 homes in escrow.
Inventory of single-family, re-sale homes was up 1.5% compared to last year. As of January 5th, there were 264 homes for sale in Santa Clara County. The average since January 2000 is 2,703.
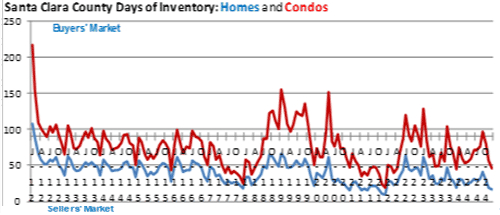
Days of Inventory, or how long it would take to sell all homes listed for sale at the current rate of sales, fell from 18 days to 17 days. The average since 2003 is 89.
It took twenty-six days to sell a home last month. That is the time from when a home is listed for sale to when it goes into contract.
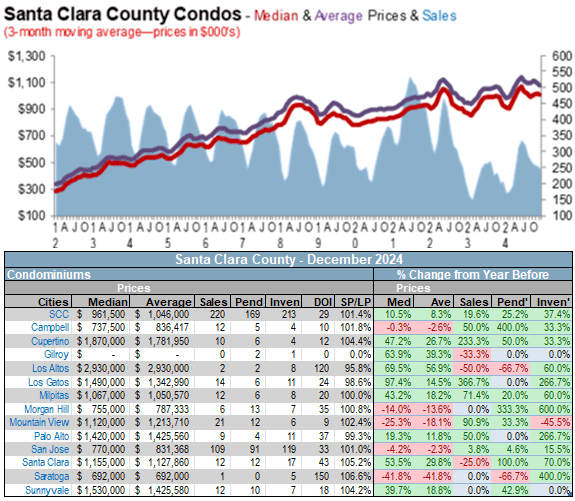
Condo prices were also up last month. The median sales price for condos was up 10.5% compared to last December. The median sales price was $961,500. The average sales price gained 8.3% year-over-year. The average sales price was $1,046,000.
Condo sales were up 19.6%. There were 220 condos sold in December.
The sales price to list price ratio fell from 101.7% to 101.4%.
Pending sales were up 25.2% year-over-year. There are 169 condos in escrow.
Condo inventory was up 37.4% compared to last December.
As of January 5th, there were 213 condos for sale in Santa Clara County. The average since January 2000 is 757.
Days of inventory fell from thirty-eight to twenty-nine.
It took an average of thirty-six days to sell a condo last month.
If you are planning on selling your property, call me for a free comparative market analysis.
December 2024 Sales Statistics (SCC)
* Total inventory is active listings plus pending listings. Active listings do not include 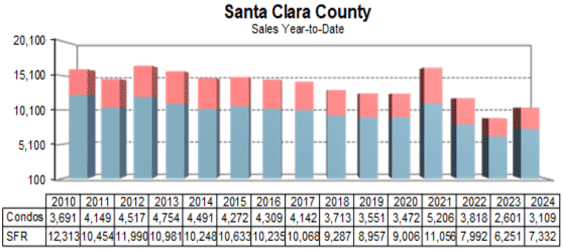 pending.
More information is available in our on-line report at http://avi.rereport.com/market_reports
Rates Firming, Calendar Turning (SCC & SMC)
December 27, 2024 — We’re at the end of a year again already, something that only seems to occur more quickly with the passage of time. At this time of year, it’s commonplace to take time to reflect on what was and contemplate what may be, always hoping for better than what came before.
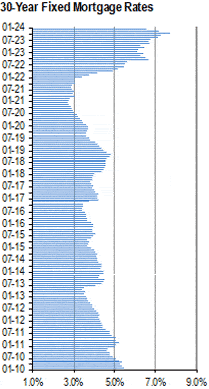
It may not seem much like it, but for mortgage rates, things were sort of better this year than last. While 30-year fixed mortgage rates posted nearly identical bottoms (6.08% in 2024, 6.09% in 2023) the peaks were certainly different, as were the conditions that got them there. The high water mark for 2024 of 7.22% was significantly lower than 2023’s 20+ year high of 7.79%, but both years’ peak rates were more than sufficiently high to quash both home sales and refinancing.
That said, the pattern certainly changed. In 2023, rates essentially started low and mostly rose through the entire year; last year, it’s been a bit more roller coaster-ish — generally rising for four months, falling for five, then rising again for three. The latest three months of increases (October through now) have come despite the Fed slashing short-term rates by a full percentage point in just three months’ time. This again underscores how mortgage rates don’t follow what the Fed does with policy rates, at least in any immediate fashion. Investor concerns about stubborn inflation have caused mortgage rates to firm over this time, and we’ll need to see price pressures subside further in order to have mortgage rates trend lower.
Mortgage rates are often described as a “spread” product, although more accurately it is Mortgage-Backed Securities (MBS) that are. That said, the description is fair enough in that a relationship against other financial instruments can be regularly observed. For mortgage rates, the yield on the low-risk 10-year Treasury is a good proxy for movements, and for a long run of history, the average rate for a conforming 30-year fixed rate was commonly found 150-180 basis points above this yield. In turbulent times for the economy or housing, this spread balloons, as it takes much higher returns to get investors to buy MBS at a time when identifiable risks are rising or high. These spreads can be and have been narrowed appreciably at times when a large buyer steps in, as the Fed did after the financial crisis and again when the pandemic upended the economy.
With this in mind, and as you might expect, spreads widened appreciably after the Fed stepped away from buying MBS, and most especially since they began the process of reducing their mortgage holding. So far, this has been occurring at a glacial pace, as refinancing activity has been very subdued for several years, and was recently pegged at levels last seen nearly 30 years ago. The slow drip of principal repayment by homeowners whose mortgages make up the securities the Fed holds is essentially the only way reductions of mortgage holdings are happening in the Fed’s balance sheet.
Home sales have also been very sluggish for some time, issuance of new MBS for investors to absorb has also been low. It may just be that the current level of new MBS is at or perhaps even below the level the market collectively can handle, and that demand for product is meeting or perhaps exceeding present supply. While there are likely other factors at work, it’s a good a reason as any to explain why spreads have generally been declining in recent months. In fact, the spread differential in the week ending December 20 was just 224 basis points, the narrowest gap since mid-June 2022, probably not coincidentally the first month where the Fed began actively reducing its mortgage holdings.
After fall storms in the south and southeast crushed activity in October, sales of new homes perked up a little bit in November. The month saw a 5.9% increase in sales to a 664,000 level, and October’s figure was revised upward by 17K to a 627,000 annualized pace. Even with the lift in sales, builders put more homes on the market; the 490,000 (annualized) homes available for purchase is the highest figure in about 17 years, and represents 8.9 months of supply at the current rate of sale. Builders are helping to move homes by offering financing incentives or concession on price, and the $402,600 median sales price for a newly-constructed home is the least expensive it as been since February 2022. Sellers of existing homes are of course much more sticky when it comes to cutting sale prices, and new homes are competing very effectively on price compared to existing homes, even with typical seasonal price softening.
Call or email me if you have any questions.
For further details and a city-by-city breakdown statistics, go to http://avi.rereport.com/market_reports.
Real estate related Articles
| SJM 12-10-2025 | California’s home insurance crisis: Which Bay Area neighborhoods have lost the most coverage |
| Tribune News Service 12-06-2025 | US cities cut red tape to turn unused office buildings into housing By Tribune News Service |
| REDFINE News 12-04-2025 | Redfin’s 2025 Predictions: Pent-Up Demand Will Lead to More Home Sales, But Many Would-Be Buyers Will Opt to Rent By Daryl Fairweather and Chen Zhao |
California homeowners interested in building accessory dwelling units on their property just caught a break, potentially shaving off thousands of dollars in fees and permits.
In a move proponents say will help ease the Bay Area’s housing crisis, Gov. Jerry Brown on Tuesday signed Senate Bill 1069, making the so-called “granny units” easier and less expensive to build throughout the state.
For more read California eases restrictions on ‘granny units’ and http://www.hcd.ca.gov/policy-research/AccessoryDwellingUnits.shtml
Helpful resource for home owners
Many new home owners or owners who consider remodeling or rebuilding their homes should take advantage of their county Tax Assessor web site. These web site and their respective city building departments web site typically have vest information regarding the process for applying for permits, the impact on their taxes and many other resources that home owners should be aware are available for them.
For the San Mateo County Tax Assessor office visit http://www.smcare.org/default.asp
For Santa Clara County Tax Assessor visit https://www.sccassessor.org/index.php
The Silicon Valley 150 Index Corner
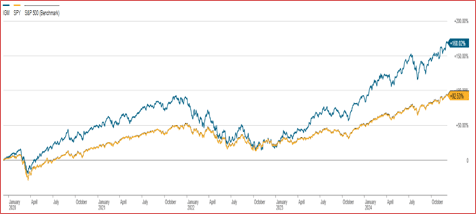
The Silicon Valley’s Real estate market is a derivative of the local economy–it prospers and withers depending on how well the local innovation-based sector performs. The San Jose Mercury News tracks the performances of the largest 150 publicly traded companies headquartered in Silicon Valley through an index called the SV150, which may be found at www.mercurynews.com. Stocks are valued based on several criteria, but one of the more important criteria is a company’s future earnings. Therefore, I see the SV150 as a leading indicator for Silicon Valley’s real estate market.
Investors Corner
S&P CoreLogic Case-Shiller Index Records 4.2% Annua Gain in September 2024
NEW YORK, DECEMBER 31, 2024: S&P Dow Jones Indices (S&P DJI) today released the October 2024 results for the S&P CoreLogic Case-Shiller Indices. The leading measure of U.S. home prices recorded a 3.6% annual gain in October 2024, a slight deceleration from the previous annual gains in 2024. More than 27 years of history are available for the data series and can be accessed in full by going to CLICK HERE
U.S. Housing Markets Moving Into Rent Territory for First Time in Over 8 Years: Report
Is it time to seriously consider investing in real estate?
Signup for my Real Estate Investment Alerts and you’ll receive my real estate investment opportunities.
San Mateo County (SMC): Home Prices Up, Sales Down in December
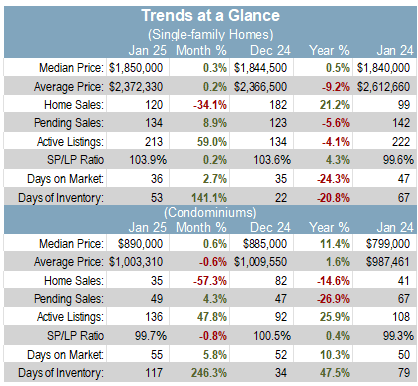
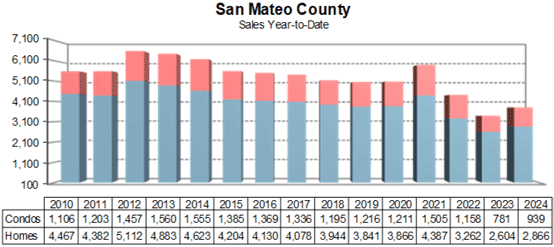
Sales of single-family, re-sale homes in San Mateo County fell 14.6% in December, year-over-year. There were 182 homes sold in San Mateo County last month. The average since 2000 is 398.
The median sales price for single-family, re-sale homes was $1,844,500. It was up 6.9% compared to last year.
The average sales price rose 3% year-over-year.
The sales price to list price ratio fell from 104.9% to 103.6%.
Inventory of single-family, re-sale homes was down 17.3% compared to last year. As of January 5th, there were 134 homes for sale in San Mateo County. The average since January 2000 is 1,287.
Days of Inventory, or the amount of time it would take to sell all homes for sale divided by how many homes have sold, fell from thirty days to twenty-two days.
It took thirty-five days, on average, to sell a home last month. That is the time from when a home is listed to when it goes into contract.
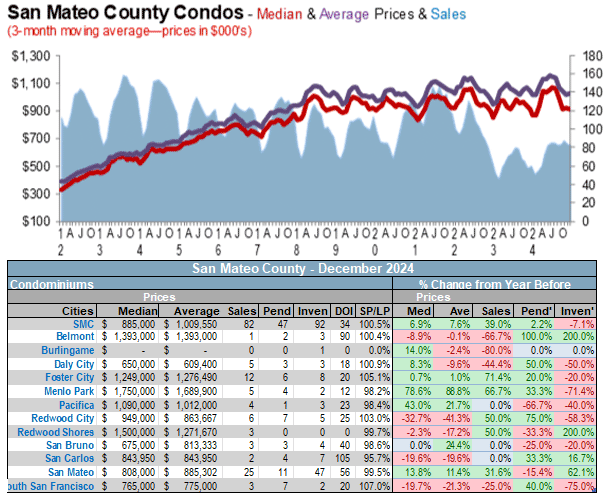
The median sales price for re-sale condos rose 6.9% year-over-year.
Year-over-year, the average sales price rose 7.6%.
Condo sales were up 39% year-over-year. There were 82 condos sold last month. The average since January 2003 is 122.
Inventory was down 7.1% year-over-year.
As of January 5th, there were 92 condos for sale in San Mateo County. The average since January 2003 is 350.
Days of inventory fell from fifty-four to thirty-four.
It took an average of fifty-two days to sell a condo last month.
If you are planning on selling your property, call me for a free comparative market analysis.
December 2024 Sales Statistics (SMC)
* Total inventory is active listings plus pending listings. Active listings do not include pending.
You can get more information at: http://avi.rereport.com/market_reports
Call or email me if you have any questions.
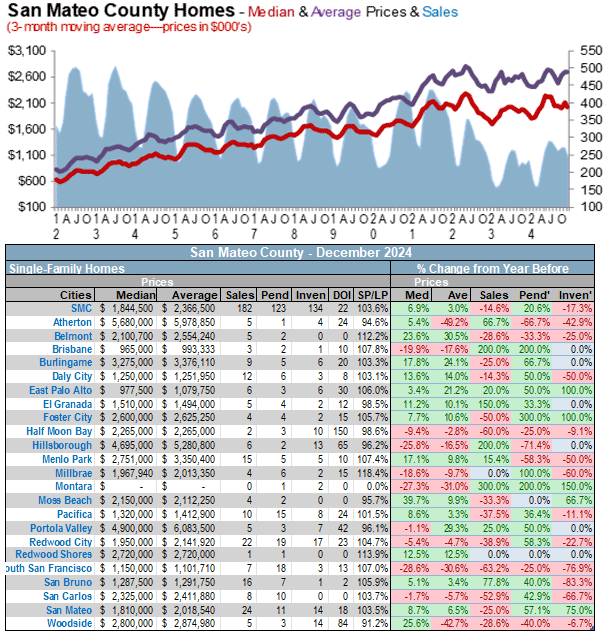
For further details and a city-by-city breakdown statistics, go to http://avi.rereport.com/market_reports.